LET’S WORK SMARTER

Understand what people are saying about your city, neighbourhoods,
and local businesses without relying only on static reports or one-off surveys.
VibeCheck analyzes reviews, social media, search trends, and location-based signals
to show where attention is growing, where sentiment is changing, and where action is needed.

Turn public feedback into clear priorities for improvement, promotion, and decision-making.

Social Data Analysis

Track how public interest and conversation are changing across cities, neighbourhoods, destinations, and businesses.

Keyword & Context Analysis

Understand the meaning behind public feedback by identifying sentiment, atmosphere, intent, and recurring themes within reviews and online conversations.

Data-Driven Indexing

Convert unstructured public feedback into measurable indicators, including the Vibe Index, to visualize local performance, popularity, and reputation.

Sentiment & Competitive Comparison

Compare positive and negative perception across cities, districts, business categories, and individual locations to identify strengths, weaknesses, and competitive positioning.

Strategic Recommendations

Receive practical insights on improvement areas, promotion opportunities, and local strategy so your team can move from observation to action.

Turn Local Data Into Actionable Strategy Your City’s Vibe, Measured and Mapped

Interactive City Map

Interactive City Map
Interactive City Map image area

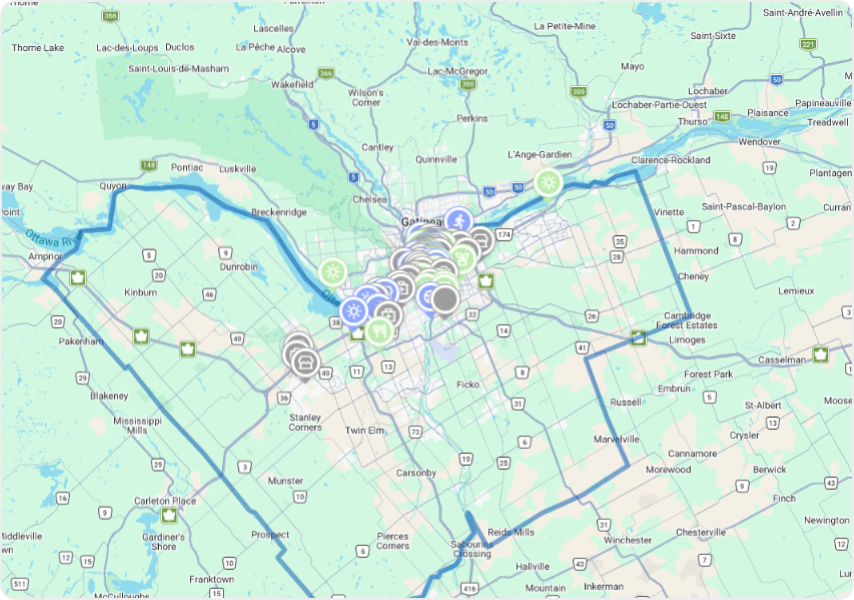
Explore reviews, sentiment, and local activity across cities, neighbourhoods, and specific places through an interactive map. VibeCheck helps you identify active areas, emerging trends, high-performing locations, and places that may need attention.

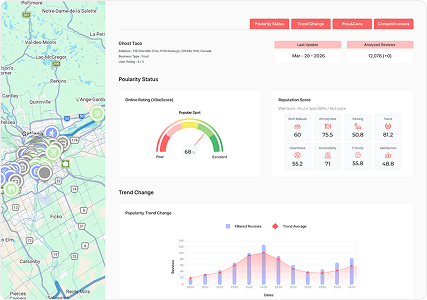
Popularity Status

Popularity Status
Popularity Status image area

Understand which places are gaining attention and which are losing momentum. The Vibe Index measures each location’s popularity, visibility, and performance, helping your team identify where to promote, where to support, and where to improve.

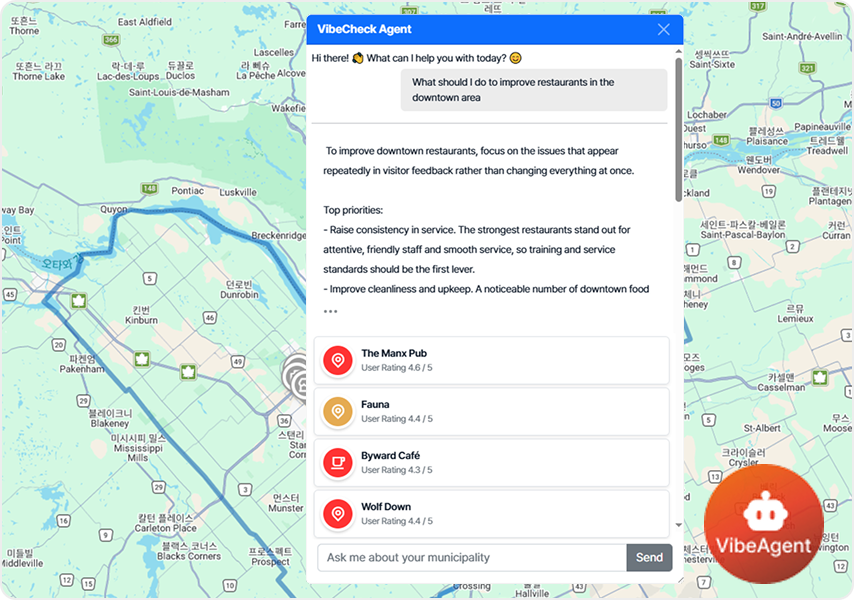
VibeCheck Agent

VibeCheck Agent
VibeCheck Agent image area

Ask questions directly from your analyzed data. VibeCheck Agent helps users explore insights without manually searching through dashboards, making it easier to understand places, categories, issues, and trends.

City Overview

City Overview
City Overview image area

See the current state of your city at a glance. VibeCheck summarizes citywide indicators such as local activity, public sentiment, popularity growth, business category trends, and improvement signals to help your team quickly understand where things stand.

Online Competitiveness

Online Competitiveness
Online Competitiveness image area

See how your city performs in the digital landscape. VibeCheck measures online awareness and recognition by analyzing how often local attractions, districts, businesses, and experiences are mentioned across public digital channels.

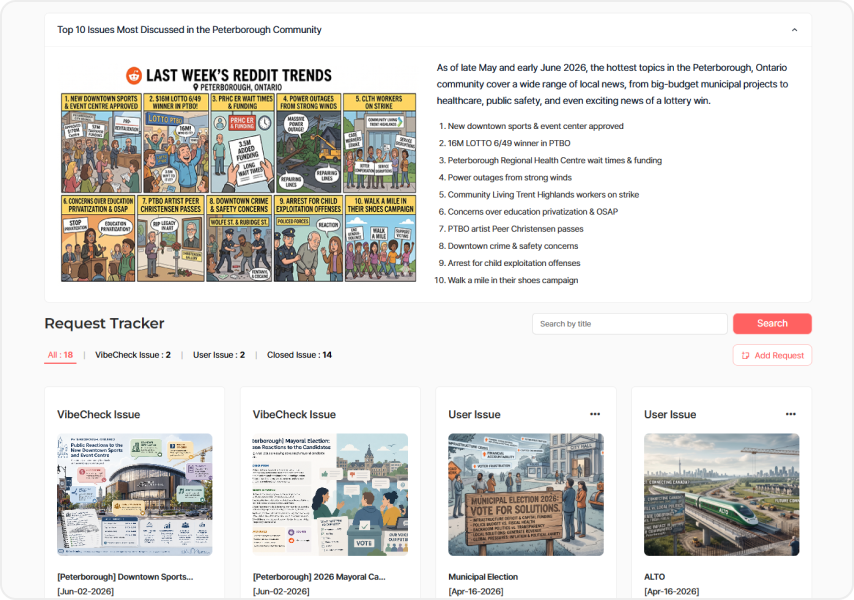
Request Tracker

Request Tracker
Request Tracker image area

Choose the topics you want to monitor, such as local events, public projects, tourism campaigns, downtown activity, or community issues. VibeCheck analyzes online conversations around those topics and provides regular updates as public sentiment changes over time.

Frequently
Asked Questions

VibeCheck is an AI-powered business intelligence platform that analyzes millions of data points from online reviews, social media, search trends, and other sources to measure public sentiment, interest, and activity across specific locations—including neighbourhoods, cities, tourism destinations, and individual businesses.

The platform is designed for municipalities, tourism organizations, local businesses, and companies seeking answers to questions such as:

  • What do people really think about this area?
  • Which locations are gaining momentum, and which are losing activity?
  • How does our city or area perform compared with other locations?

VibeCheck helps organizations benchmark performance and make informed decisions without relying solely on surveys, assumptions, or lengthy reporting processes.

Rather than simply showing what people are saying online, VibeCheck turns complex social data into actionable insights. It helps users understand what is happening, why it matters, and where improvement efforts should be focused.
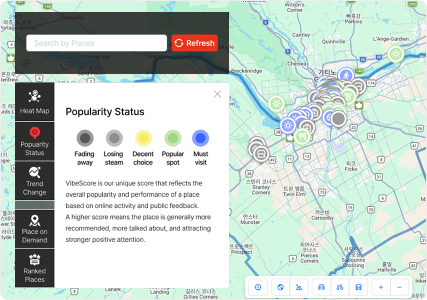
Vibe Score is VibeCheck’s proprietary metric for measuring the overall popularity, attractiveness, and performance of a location.

Using AI and big data analytics, VibeCheck collects and analyzes social data to identify meaningful signals within public reactions. These signals are translated into quantitative indicators that can be used to assess areas such as:

  • City competitiveness
  • Place attractiveness
  • Industry and consumer trends
  • Service reputation

A higher Vibe Score generally indicates stronger public interest, more favourable perceptions, and a greater likelihood that a location will be recommended.

The VibeCheck dashboard presents locations by business category and performance level using intuitive colour-coded visualizations. This allows users to quickly identify which areas are thriving, which are losing momentum, and where improvement efforts may have the greatest impact.

VibeCheck analyzes publicly available data such as online reviews, social media posts, search trends, and other location- or topic-related digital signals.

Depending on the project, client-owned data, survey results, foot traffic data, or public datasets may also be integrated to provide a more comprehensive view.

VibeCheck collects and updates data on a weekly basis. The dashboard is refreshed once a week to reflect recent changes in public sentiment, interest, activity, and location performance.

The latest data update date is displayed within the platform, allowing users to confirm when the information was last refreshed.

VibeCheck can support a wide range of use cases, including:

  • Monitoring city or neighbourhood reputation
  • Identifying emerging local issues and trends
  • Evaluating tourism destinations and commercial areas
  • Comparing cities, regions, or individual businesses
  • Tracking public reactions to events, policies, or services
  • Identifying areas that may require operational or marketing improvements

Traditional social listening tools primarily track mentions, keywords, or sentiment. VibeCheck goes further by organizing these signals around specific cities, areas, places, and businesses.

It combines location-based analysis, comparative benchmarking, the Vibe Score, and AI-generated insights to help users understand not only what people are saying, but also what is changing and where action may be needed.

Yes. VibeCheck allows users to compare selected cities, areas, tourism destinations, or businesses based on available data and relevant performance indicators.

These comparisons help users identify relative strengths, weaknesses, changes in public interest, and differences in reputation or activity across locations.

VibeCheck analyzes publicly available content, such as online reviews and social media posts, to identify patterns in public sentiment, interests, and activity.

The data used for analysis does not include personal information intended to identify or profile individual users. VibeCheck focuses on the content of reviews and posts rather than personal details such as names, contact information, or individual account information.

The analyzed results are presented as aggregated insights at the level of a location, topic, industry, or business. VibeCheck does not use the data to track individuals or evaluate individual behaviour.

Yes. A proof of concept, or PoC, may be available before subscription, depending on the size, characteristics, and objectives of the city, area, or organization.

A PoC can be designed around:

  • A specific city or area
  • A local event or tourism initiative
  • Selected VibeCheck features
  • A particular business or industry use case

VibeCheck can also support API integration with existing systems, the integration of client-owned data, and customized platform configurations.

To discuss the scope and suitability of a PoC, please contact us at biz@vibeai.ai.

VibeCheck offers a variety of analytical data to help you better understand cities, places, and businesses. Some of the key data types you can explore are listed below.

Online Rating
  • Shows the city’s overall online visibility and recognition based on selected local attractions. Higher scores indicate stronger public awareness and interest.
Positive vs Negative
  • Shows the proportion of positive and negative sentiment identified in customer reviews.
Feature Keywords
  • Shows how frequently key features and topics are mentioned in customer reviews.
Popularity Growth
  • Tracks changes in the city’s online awareness over time. Spikes and declines may reflect seasonal events, social trends, marketing activities, or other external factors.
City Comparison
  • Select up to two cities to compare their Vibe Score–based reputation indicators.
  • Select up to 2 cities to compare their VibeScore-based reputation index.
Business Share within the city
  • Compares the share of review activity across business types in the selected cities. A higher share indicates greater customer attention within that city.
Pros & Cons
  • Shows the most frequently mentioned positive and negative aspects of each selected city.
Improvement Score
  • Highlights potential areas for improvement by service category and tracks weekly changes in review activity for each business.
Summary Feed
  • Shows the volume of positive and negative keywords identified in social media content and customer reviews about this place.
Competitiveness
  • Shows the five highest-ranking places in the same business type, based on their Vibe Scores.
Market Share
  • Shows each place’s relative share within its business type in the selected city.
Activity Score
  • Measures how active and lively the city feels, based on factors such as outdoor activities, local events, and overall community activity.
Transit Score
  • Measures how convenient people find transportation in the city, including access to public transit, connections to surrounding areas, and ease of travel between neighbourhoods.
Cleanliness Score
  • Measures how clean and well-maintained the city feels to residents and visitors.
Accessibility Score
  • Measures how easy and convenient it is for residents and visitors to access local businesses. Factors may include walkability, barrier-free access, parking availability, and pet-friendly access.
Popular Places
  • Shows the number of places that received a significant increase in reviews during the current weekly analysis period.
Places Analyzed
  • Shows the number of places with newly added reviews that were analyzed during the current weekly analysis period.
Needs Improvement
  • Highlights places that experienced a significant increase in negative reviews during the current weekly analysis period.
Business Competitiveness
  • Shows how review activity and customer sentiment are distributed across different business categories.
Growth Rate
  • Shows how the place’s Vibe Score has changed this week based on the balance of positive and negative reviews.
Reputation Score
  • A component of the Vibe Score that quantifies the place’s performance across individual service categories based on social data analysis.
Staff Attitude
  • Measures how friendly, helpful, and attentive the staff are, based on customer reviews and service-related feedback.
Atmosphere
  • Measures how visitors perceive the overall atmosphere of the place, including qualities such as being cozy, trendy, lively, or romantic.
Parking
  • Measures how convenient and accessible parking is for visitors, based on customer reviews.
Trend
  • Shows how the level of online attention and discussion surrounding the place has changed over time.
Cleanliness
  • Measures how clean, comfortable, and well-maintained the place feels to visitors, based on customer reviews.
Accessibility
  • Measures how easy the place is to reach, including access by walking, driving, and public transit.
Friendly
  • Measures how welcoming and inclusive the place feels, including whether it is family-friendly, pet-friendly, and comfortable for different types of visitors.
Satisfaction
  • Measures the overall level of customer satisfaction with the place, based on review analysis.
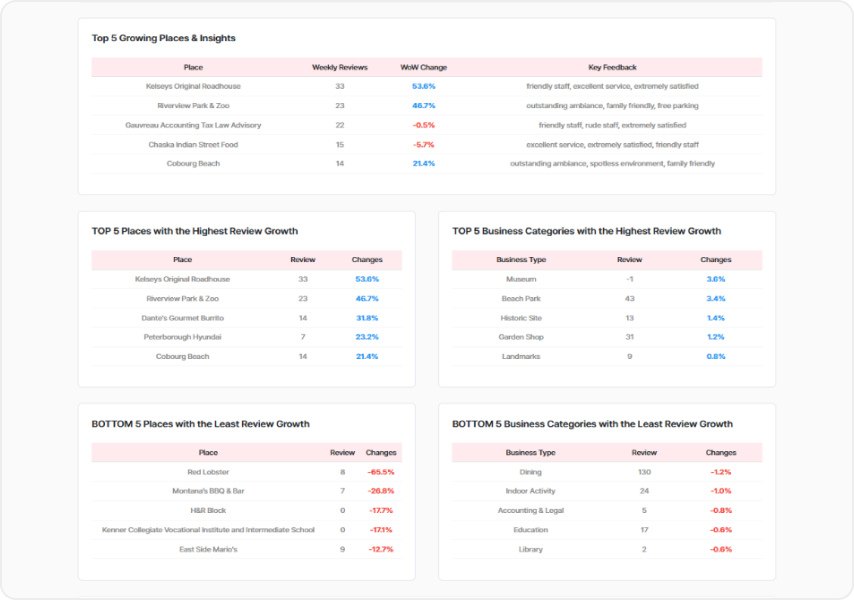
Top 5 Growing Places & Insights
  • Highlights the five places that showed the most notable growth this week, along with key insights identified through review analysis.
TOP 5 Places with the Highest Review Growth
  • Shows the five places with the highest increase in review activity during this week’s analysis period.
TOP 5 Business Categories with the Highest Review Growth
  • Shows the five business categories with the largest increase in review activity during this week’s analysis period.
BOTTOM 5 Places with the Least Review Growth
  • Shows the five places with the lowest review growth during this week’s analysis period.
BOTTOM 5 Business Categories with the Least Review Growth
  • Shows the five business categories with the lowest review growth during this week’s analysis period.
Keywords to Check
  • Highlights key strengths and areas for improvement identified through customer review analysis.
Trend Change
  • Shows how the level of online attention and discussion surrounding this place has changed based on review activity.
Popularity Trend
  • Visualizes changes in the place’s online visibility over time based on review activity, helping you identify whether its popularity is growing or declining.
Review Volume Trend by Period
  • Shows weekly changes in the number of reviews related to the tracked request topic. Larger values on the graph indicate higher review activity and greater public interest.
Review Analysis Result
  • Summarizes the most frequently mentioned themes and feedback identified through analysis of the collected review content.
Community Narrative Summary
  • Summarizes the key issues, topics, and perspectives being discussed in the community based on collected and analyzed reviews.
Overall Keyword Ranking
  • Ranks the most frequently mentioned keywords found in reviews related to the tracked issue.
Analyzed Reviews
  • Shows the cumulative number of reviews analyzed for the tracked issue.
Trend of Changes
  • Compares changes in review activity for each selected place over time, helping you identify differences in their level of online attention and visibility.
TOP Best Places
  • Shows the five highest-ranked places within the same business category, based on both review growth and customer ratings.